
Introduction
Python has established itself as the lingua franca of data science, offering unparalleled flexibility, readability, and a robust ecosystem of specialized libraries. These libraries serve as the fundamental building blocks that empower data scientists to transform raw data into meaningful insights. Whether you’re performing data manipulation, statistical analysis, machine learning, or data visualization, Python’s libraries provide the essential tools to streamline your workflow and enhance your productivity. In this comprehensive guide, we’ll explore ten indispensable Python libraries that should be in every data scientist’s toolkit, examining their core functionalities, practical applications, and how they can elevate your data science projects to new heights.
1. NumPy: The Numerical Computing Foundation
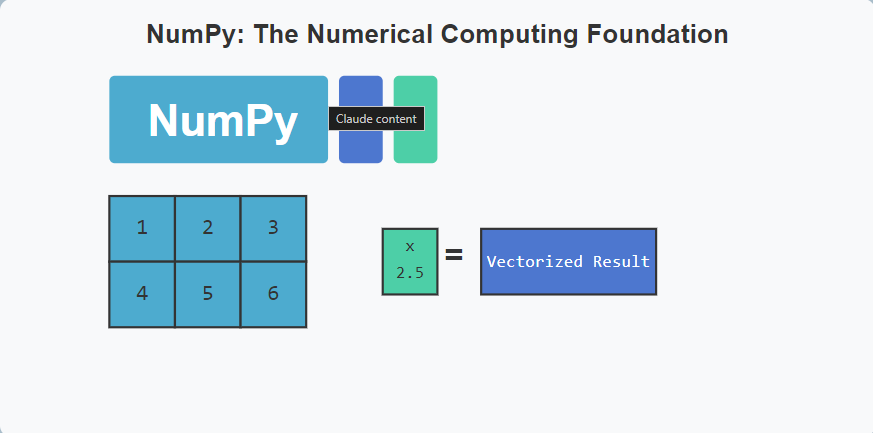
NumPy (Numerical Python) stands as the cornerstone of scientific computing in Python, providing powerful capabilities for handling multi-dimensional arrays and matrices. This fundamental library underpins virtually every data science workflow, offering the computational efficiency needed for processing large datasets and complex mathematical operations.
NumPy’s key strengths include its vectorized operations, which allow you to perform calculations on entire arrays without explicit loops, significantly improving performance. The library also provides an extensive collection of mathematical functions, random number generators, linear algebra operations, and Fourier transforms, making it invaluable for scientific computing tasks.
Mastering Array Manipulation for Performance Optimization
NumPy’s array manipulation capabilities enable data scientists to efficiently reshape, slice, and transform multi-dimensional data. The broadcasting feature automatically handles operations between arrays of different shapes, eliminating the need for explicit loops and improving both code readability and execution speed.
import numpy as np

# Creating arrays
array_1d = np.array([1, 2, 3, 4, 5])
array_2d = np.array([[1, 2, 3], [4, 5, 6]])

# Array operations
mean_value = np.mean(array_2d)
matrix_product = np.dot(array_2d, array_2d.T)

# Broadcasting example
scaled_array = array_2d * 2.5
By mastering NumPy’s array operations, you can write more concise, readable, and efficient code, which becomes particularly crucial when working with large datasets that would otherwise strain computational resources.
2. Pandas: Data Manipulation and Analysis Made Simple
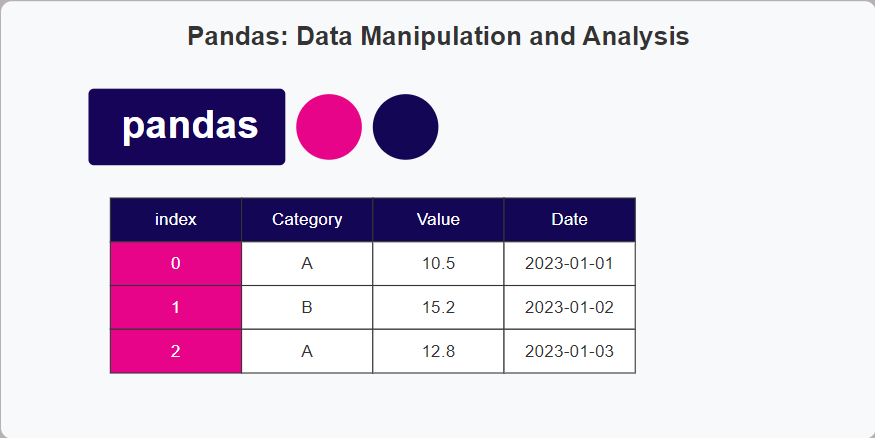
Pandas revolutionizes data manipulation and analysis in Python by providing high-performance, easy-to-use data structures and data analysis tools. The library’s DataFrame object has become synonymous with tabular data handling, offering a flexible and intuitive interface similar to spreadsheets or SQL tables.
Pandas excels at handling real-world data with its robust capabilities for reading and writing data in various formats (CSV, Excel, SQL databases, JSON), cleaning messy data, handling missing values, and performing group-by aggregations. Its integration with NumPy enables efficient numerical computations, while its rich indexing functionality facilitates complex data selection and filtering.
Transforming Data with Advanced DataFrame Operations
Pandas offers powerful data transformation capabilities through its GroupBy, Merge, and Pivot operations, allowing data scientists to reshape and aggregate data efficiently.
import pandas as pd

# Reading data
df = pd.read_csv('data.csv')

# Data cleaning
df_cleaned = df.dropna().drop_duplicates()

# Advanced transformations
grouped_data = df.groupby('category').agg({'value': ['mean', 'sum', 'count']})
pivoted_data = df.pivot_table(index='date', columns='category', values='amount')

# Time series functionality
monthly_data = df.resample('M', on='date').sum()
The library’s time series functionality makes it particularly valuable for financial analysis, sales forecasting, and other time-dependent applications. By leveraging Pandas’ advanced operations, you can transform raw data into structured formats suitable for analysis and visualization, streamlining the data preparation phase that typically consumes most of a data scientist’s time.
3. Matplotlib: The Versatile Visualization Library
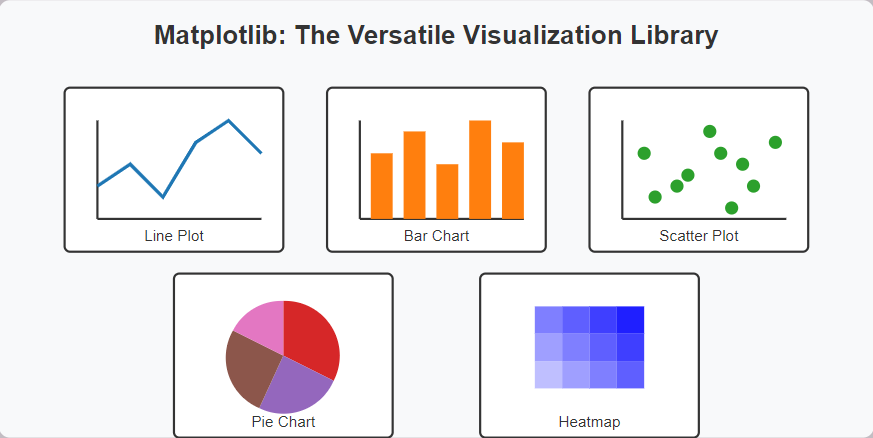
Matplotlib provides the foundation for data visualization in Python, offering a comprehensive set of tools for creating static, animated, and interactive visualizations. Its flexibility allows data scientists to craft everything from simple line plots to complex multi-panel figures with precise control over every visual element.
The library supports various plot types including line charts, scatter plots, bar charts, histograms, pie charts, and more specialized visualizations such as contour plots and 3D surfaces. Matplotlib’s object-oriented API enables fine-grained customization of plot elements, making it suitable for publication-quality graphics.
Creating Publication-Quality Visualizations
Matplotlib’s layered architecture allows data scientists to create complex, publication-ready visualizations by building plots component by component.
import matplotlib.pyplot as plt
import numpy as np

# Create figure and axes
fig, ax = plt.subplots(figsize=(10, 6))

# Generate data
x = np.linspace(0, 10, 100)
y1 = np.sin(x)
y2 = np.cos(x)

# Plot data with customization
ax.plot(x, y1, label='Sin(x)', color='blue', linewidth=2)
ax.plot(x, y2, label='Cos(x)', color='red', linestyle='--', linewidth=2)

# Add annotations and styling
ax.set_title('Sine and Cosine Functions', fontsize=16)
ax.set_xlabel('x values', fontsize=12)
ax.set_ylabel('y values', fontsize=12)
ax.grid(True, linestyle=':')
ax.legend(loc='best')

# Customize appearance
plt.tight_layout()
plt.savefig('trigonometric_functions.png', dpi=300)
plt.show()
By mastering Matplotlib’s capabilities, you can effectively communicate your data findings through clear, informative, and visually appealing graphics that enhance understanding and engagement with your analysis.
4. Scikit-learn: The Machine Learning Powerhouse
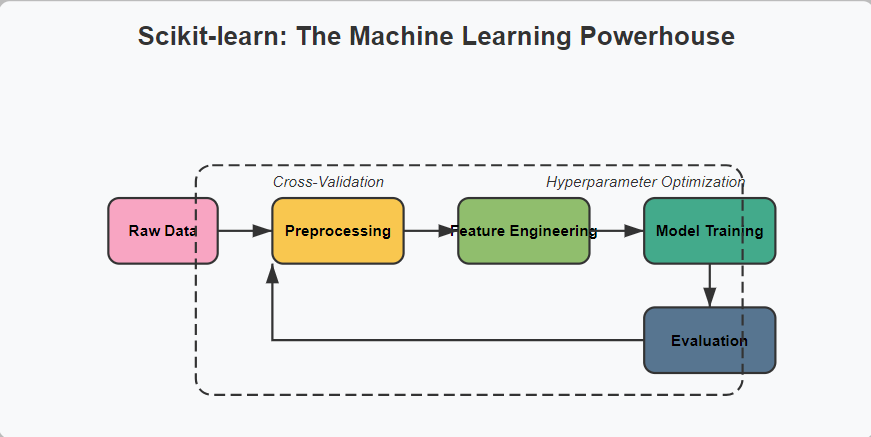
Scikit-learn has established itself as the go-to library for machine learning in Python, providing a consistent and user-friendly API for a wide range of algorithms. Its comprehensive collection includes tools for classification, regression, clustering, dimensionality reduction, model selection, and preprocessing, making it an essential component in any data scientist’s toolkit.
The library emphasizes ease of use, performance, and documentation, allowing practitioners to quickly implement and experiment with different machine learning approaches. Its consistent interface enables data scientists to easily swap algorithms without changing the surrounding code, facilitating model comparison and selection.
Streamlining the Machine Learning Pipeline
Scikit-learn provides powerful tools for building end-to-end machine learning pipelines, from data preprocessing to model evaluation.
from sklearn.model_selection import train_test_split, GridSearchCV
from sklearn.preprocessing import StandardScaler
from sklearn.pipeline import Pipeline
from sklearn.ensemble import RandomForestClassifier
from sklearn.metrics import classification_report

# Prepare data
X_train, X_test, y_train, y_test = train_test_split(X, y, test_size=0.2, random_state=42)

# Create pipeline
pipeline = Pipeline([
    ('scaler', StandardScaler()),
    ('classifier', RandomForestClassifier())
])

# Define hyperparameter search space
param_grid = {
    'classifier__n_estimators': [100, 200, 300],
    'classifier__max_depth': [None, 10, 20],
    'classifier__min_samples_split': [2, 5, 10]
}

# Tune hyperparameters with cross-validation
grid_search = GridSearchCV(pipeline, param_grid, cv=5, scoring='f1')
grid_search.fit(X_train, y_train)

# Evaluate best model
best_model = grid_search.best_estimator_
y_pred = best_model.predict(X_test)
print(classification_report(y_test, y_pred))
Scikit-learn’s extensive documentation, tutorials, and examples make it accessible to beginners while still offering advanced functionality for experienced practitioners. By leveraging its preprocessing tools, cross-validation capabilities, and model selection utilities, you can develop robust machine learning solutions with less code and greater confidence in their performance.
5. TensorFlow: Deep Learning at Scale
TensorFlow has emerged as one of the leading deep learning frameworks, offering a comprehensive ecosystem for building and deploying machine learning models with a focus on neural networks. Developed by Google, TensorFlow provides both high-level APIs for rapid prototyping and low-level control for complex model architectures, making it suitable for research and production environments alike.
The library excels at handling large-scale machine learning tasks, with built-in support for distributed training across multiple GPUs and TPUs. TensorFlow’s computational graph approach enables automatic differentiation, optimization of execution, and deployment across various platforms from servers to mobile devices.
Building Complex Neural Networks with Keras
TensorFlow’s integration with Keras provides an intuitive API for constructing deep neural networks with minimal code.
import tensorflow as tf
from tensorflow.keras.models import Sequential
from tensorflow.keras.layers import Dense, Conv2D, MaxPooling2D, Flatten, Dropout
from tensorflow.keras.optimizers import Adam

# Define CNN model for image classification
model = Sequential([
    # Convolutional layers
    Conv2D(32, (3, 3), activation='relu', input_shape=(28, 28, 1)),
    MaxPooling2D((2, 2)),
    Conv2D(64, (3, 3), activation='relu'),
    MaxPooling2D((2, 2)),

    # Flatten and dense layers
    Flatten(),
    Dense(128, activation='relu'),
    Dropout(0.5),
    Dense(10, activation='softmax')
])

# Compile model
model.compile(
    optimizer=Adam(learning_rate=0.001),
    loss='sparse_categorical_crossentropy',
    metrics=['accuracy']
)

# Train model
history = model.fit(
    X_train, y_train,
    epochs=10,
    batch_size=128,
    validation_data=(X_val, y_val),
    callbacks=[tf.keras.callbacks.EarlyStopping(patience=3)]
)
TensorFlow’s ecosystem includes TensorBoard for visualization, TensorFlow Extended (TFX) for production pipelines, and TensorFlow Serving for model deployment, providing comprehensive tools for the entire machine learning lifecycle. By mastering TensorFlow, data scientists can tackle complex problems in computer vision, natural language processing, and other domains requiring deep learning approaches.
6. PyTorch: Flexible and Dynamic Deep Learning
PyTorch has gained tremendous popularity in the research community and beyond for its intuitive design, dynamic computational graph, and seamless integration with Python. Unlike TensorFlow’s originally static graph approach, PyTorch’s define-by-run paradigm allows for more flexible model development and easier debugging, making it particularly well-suited for research and experimentation.
The library provides tensor computations with strong GPU acceleration, automatic differentiation for building and training neural networks, and a rich ecosystem of tools and libraries for various deep learning applications. PyTorch’s natural Python integration means that standard Python debugging tools and control flow statements work seamlessly within model definitions.
Dynamic Computational Graphs for Research Innovation
PyTorch’s dynamic computation graph enables more intuitive model development and facilitates research on complex architectures.
import torch
import torch.nn as nn
import torch.optim as optim

# Define a recurrent neural network
class RNN(nn.Module):
    def __init__(self, input_size, hidden_size, output_size):
        super(RNN, self).__init__()
        self.hidden_size = hidden_size
        self.rnn = nn.GRU(input_size, hidden_size, batch_first=True)
        self.fc = nn.Linear(hidden_size, output_size)

    def forward(self, x, hidden=None):
        # Dynamic computation allows for variable sequence lengths
        output, hidden = self.rnn(x, hidden)

        # Use only the final time step output for classification
        output = self.fc(output[:, -1, :])
        return output, hidden

# Initialize model, loss function, and optimizer
model = RNN(input_size=10, hidden_size=64, output_size=2)
criterion = nn.CrossEntropyLoss()
optimizer = optim.Adam(model.parameters(), lr=0.001)

# Training loop with dynamic computation
for epoch in range(num_epochs):
    for x_batch, y_batch in data_loader:
        # Forward pass
        outputs, _ = model(x_batch)
        loss = criterion(outputs, y_batch)

        # Backward pass and optimization
        optimizer.zero_grad()
        loss.backward()
        optimizer.step()
PyTorch’s ecosystem includes domain-specific libraries like torchvision for computer vision, torchaudio for audio processing, and torchtext for natural language processing, providing specialized tools for different applications. The library’s flexibility, combined with excellent documentation and community support, makes it an invaluable tool for data scientists working at the cutting edge of deep learning research and applications.
7. Seaborn: Statistical Data Visualization
Seaborn elevates data visualization in Python by providing a high-level interface for creating informative and attractive statistical graphics. Built on top of Matplotlib, Seaborn adds aesthetic improvements and specialized plot types specifically designed for statistical exploration and communication of findings.
This library excels at visualizing complex relationships in data through its integrated support for categorical variables, automatic aggregation, and statistical model fitting. Seaborn’s default styles and color palettes are designed with statistical visualization best practices in mind, resulting in professional-looking plots with minimal code.
Advanced Statistical Visualizations for Data Exploration
Seaborn provides specialized plot types that reveal patterns and relationships in complex datasets.
import seaborn as sns
import matplotlib.pyplot as plt

# Set aesthetic parameters
sns.set(style="whitegrid", context="talk")

# Load example dataset
tips = sns.load_dataset("tips")

# Create figure with multiple related visualizations
fig = plt.figure(figsize=(12, 10))

# Distribution plot
ax1 = fig.add_subplot(2, 2, 1)
sns.histplot(tips, x="total_bill", hue="time", element="step", stat="density", common_norm=False, ax=ax1)
ax1.set_title("Distribution of Bill Amounts by Time")

# Relationship plot with regression line
ax2 = fig.add_subplot(2, 2, 2)
sns.regplot(x="total_bill", y="tip", data=tips, ax=ax2)
ax2.set_title("Relationship Between Bill Amount and Tip")

# Categorical plot
ax3 = fig.add_subplot(2, 2, 3)
sns.boxplot(x="day", y="total_bill", hue="smoker", data=tips, ax=ax3)
ax3.set_title("Bill Distribution by Day and Smoker Status")

# Matrix plot
ax4 = fig.add_subplot(2, 2, 4)
sns.heatmap(tips.corr(), annot=True, cmap="coolwarm", ax=ax4)
ax4.set_title("Correlation Matrix of Numerical Variables")

plt.tight_layout()
plt.show()
Seaborn’s specialized plot types include violin plots, swarm plots, joint plots, and pair plots, each designed to illuminate different aspects of data distributions and relationships. The library’s faceting capabilities allow for easy creation of multi-panel figures that show how relationships vary across subsets of data. By incorporating Seaborn into your data science workflow, you can quickly generate insightful visualizations that communicate statistical findings effectively and aesthetically.
8. Plotly: Interactive Data Visualization
Plotly brings a new dimension to data visualization by enabling interactive, web-based graphics that allow users to explore data dynamically. This library creates visualizations that respond to user interactions such as hovering, clicking, zooming, and panning, providing a more engaging and informative experience compared to static plots.
The library supports a wide range of chart types, from basic line and bar charts to complex 3D plots, geographical maps, and specialized financial charts. Plotly’s visualizations can be embedded in web applications, Jupyter notebooks, or dashboards, making it particularly valuable for creating shareable, interactive reports.
Creating Interactive Dashboards for Data Exploration
Plotly, especially when combined with Dash, enables the creation of interactive web applications for data exploration without requiring extensive web development knowledge.
import plotly.express as px
import plotly.graph_objects as go
from plotly.subplots import make_subplots

# Create interactive scatter plot with hover information
fig = px.scatter(
    data_frame=df,
    x="gdp_per_capita",
    y="life_expectancy",
    size="population",
    color="continent",
    hover_name="country",
    size_max=60,
    animation_frame="year",
    title="GDP vs Life Expectancy Over Time",
    log_x=True
)

# Customize layout
fig.update_layout(
    width=900,
    height=600,
    xaxis_title="GDP per Capita (log scale)",
    yaxis_title="Life Expectancy (years)",
    legend_title="Continent",
    colorway=px.colors.qualitative.Plotly
)

# Add annotations
fig.add_annotation(
    x=np.log10(50000),
    y=85,
    text="Developed countries cluster",
    showarrow=True,
    arrowhead=1
)

# Show figure
fig.show()
Plotly’s integration with Dash enables the creation of full-fledged web applications with interactive controls, multiple linked visualizations, and real-time updates. This combination provides data scientists with the tools to build sophisticated data products that bridge the gap between analysis and communication, allowing stakeholders to interact directly with data and gain insights through exploration.
9. SciPy: Scientific Computing Capabilities
SciPy (Scientific Python) extends NumPy’s functionality with a rich collection of algorithms and functions for scientific and technical computing. This comprehensive library provides specialized tools for optimization, integration, interpolation, eigenvalue problems, algebraic equations, differential equations, statistics, and many other domains of scientific computing.
For data scientists, SciPy offers essential capabilities for statistical analysis, signal processing, and mathematical modeling that go beyond basic data manipulation. The library’s optimized implementations of scientific algorithms enable efficient solutions to complex computational problems without requiring specialized knowledge of the underlying numerical methods.
Advanced Statistical Analysis and Scientific Computing
SciPy’s statistics module provides powerful tools for statistical testing and analysis that complement basic descriptive statistics.
from scipy import stats
from scipy import optimize
from scipy import signal
import numpy as np

# Statistical hypothesis testing
t_stat, p_value = stats.ttest_ind(group1, group2, equal_var=False)
print(f"Independent t-test: t={t_stat:.4f}, p={p_value:.4f}")

# Non-parametric tests
u_stat, p_value = stats.mannwhitneyu(group1, group2, alternative='two-sided')
print(f"Mann-Whitney U test: U={u_stat:.4f}, p={p_value:.4f}")

# Function optimization
def objective_function(x):
    return x[0]**2 + x[1]**2 + x[0]*x[1]

result = optimize.minimize(objective_function, x0=[1, 1], method='BFGS')
print(f"Optimal solution: {result.x}, value: {result.fun}")

# Signal processing
time = np.linspace(0, 10, 1000)
signal_data = np.sin(2*np.pi*5*time) + 0.5*np.sin(2*np.pi*20*time)
filtered_signal = signal.butter_lowpass_filter(signal_data, cutoff=10, fs=100, order=5)
SciPy’s subpackages cover diverse areas including spatial data structures and algorithms (scipy.spatial), image processing (scipy.ndimage), sparse matrices (scipy.sparse), and more. The library’s consistent interface and thorough documentation make it accessible despite the complexity of the problems it addresses. By incorporating SciPy into your data science toolkit, you gain access to sophisticated algorithms that can handle specialized computational tasks across various scientific domains.
10. Statsmodels: Statistical Modeling and Inference
Statsmodels fills a crucial niche in the Python data science ecosystem by providing classes and functions specifically designed for statistical modeling, hypothesis testing, and statistical data exploration. While libraries like Scikit-learn focus on predictive modeling and machine learning, Statsmodels emphasizes statistical inference, parameter estimation, and diagnostic testing.
The library offers a comprehensive set of regression models including linear regression, generalized linear models, robust linear models, and mixed effects models. It also provides time series analysis tools, including ARIMA and VAR models, as well as various statistical tests for hypothesis testing and model diagnostics.
Rigorous Statistical Analysis and Inference
Statsmodels excels at providing detailed statistical output with confidence intervals, p-values, and diagnostic statistics for hypothesis testing and model validation.
import statsmodels.api as sm
import statsmodels.formula.api as smf
from statsmodels.tsa.arima.model import ARIMA
import pandas as pd
import numpy as np

# Multiple linear regression with detailed statistics
X = sm.add_constant(X)  # Add intercept term
model = sm.OLS(y, X)
results = model.fit()
print(results.summary())

# Formula-based interface for regression (R-style)
formula_model = smf.ols('price ~ area + bedrooms + bathrooms', data=housing_df)
formula_results = formula_model.fit()
print(formula_results.summary())

# Time series analysis with ARIMA
model = ARIMA(time_series, order=(1, 1, 1))
arima_results = model.fit()
forecast = arima_results.forecast(steps=10)
print(arima_results.summary())

# Hypothesis testing
from statsmodels.stats.anova import anova_lm
from statsmodels.stats.multicomp import pairwise_tukeyhsd

# ANOVA
anova_results = anova_lm(model1, model2)
print(anova_results)

# Multiple comparison testing
tukey_results = pairwise_tukeyhsd(data['response'], data['group'])
print(tukey_results)
Statsmodels’ emphasis on statistical inference makes it particularly valuable for research, economic analysis, and any application where understanding parameter uncertainty and statistical significance is important. The library provides detailed output tables similar to those found in statistical software like R or Stata, facilitating communication of results in academic and professional contexts. By incorporating Statsmodels into your workflow, you can complement the predictive focus of machine learning with rigorous statistical analysis and inference.
Conclusion
The ten Python libraries explored in this guide form the backbone of modern data science workflows, each addressing specific aspects of the data analysis pipeline. From NumPy’s fundamental array operations to TensorFlow and PyTorch’s advanced deep learning capabilities, these libraries collectively enable data scientists to tackle complex analytical challenges efficiently and effectively.
As you continue your data science journey, mastering these libraries will significantly enhance your productivity and expand your analytical capabilities. Each library offers unique strengths that, when combined, create a powerful toolkit for extracting meaningful insights from data. Whether you’re performing exploratory data analysis, building predictive models, or creating interactive visualizations, these Python libraries provide the essential tools to transform raw data into actionable knowledge.
Remember that the field of data science is continuously evolving, with new libraries and tools emerging regularly. Building a strong foundation with these ten essential libraries will prepare you to adapt to new developments and methodologies as they arise. By leveraging these powerful tools effectively, you’ll be well-equipped to address the diverse challenges of modern data science and make meaningful contributions in this exciting and rapidly growing field.
Related Articles:
- Learn Numpy
- Pandas
- Matplotlib Learn
- Scikit-Learn
- Tensorflow
- Ultimate Guide to Exploratory Data Analysis
- Master Data Visualization: Ultimate Guide to Matplotlib
- Neural Networks Made Easy – Start Coding Now!